Usage Dashboard
Why usage data matters
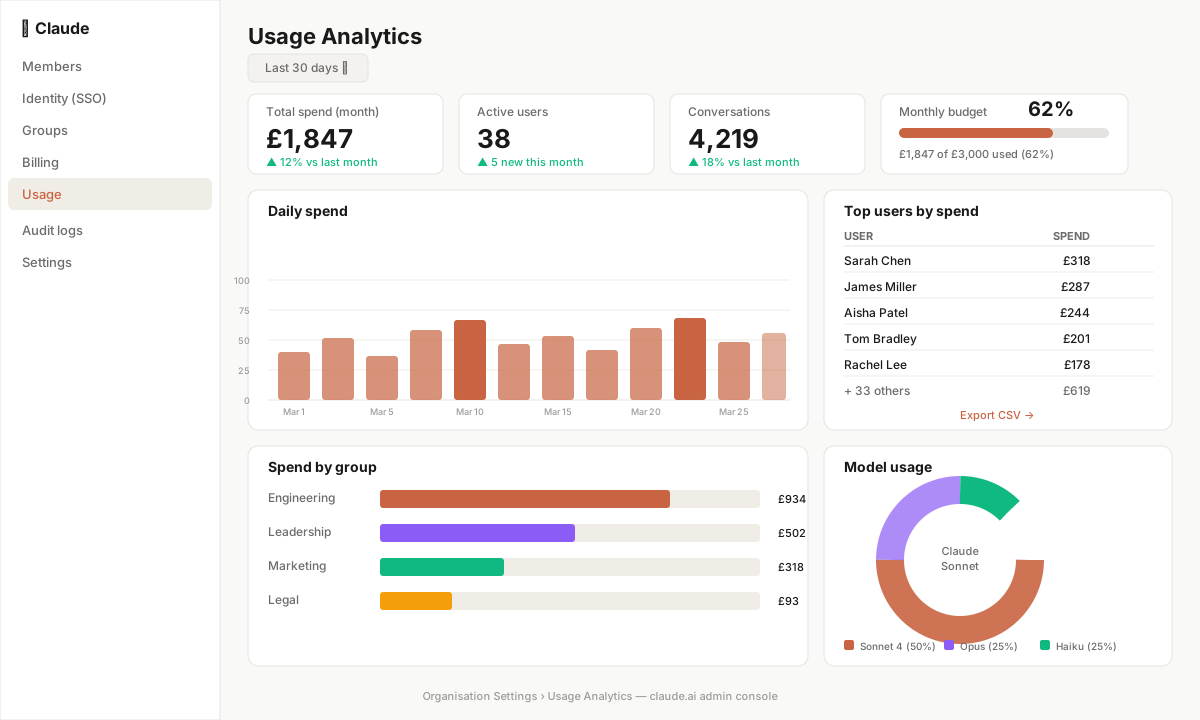
Usage data is how you answer the most important questions about your Claude Enterprise deployment:
- Is the investment paying off? (Are people actually using it?)
- Where is the value being created? (Which teams, which use cases?)
- Where are the problems? (Low adoption, no active users, dormant Projects?)
- Are we on track with our contract? (Usage against limits?)
- What should we tell leadership? (ROI narrative, adoption story)
The Usage Dashboard in the Admin Console is your primary instrument for all of these.
Accessing the dashboard
Admin Console → Overview (the landing page of the Admin Console includes key metrics) or, for more detail, some Enterprise contracts include a dedicated Analytics section accessible from the sidebar.
The exact layout and depth of analytics available to you depends on your contract tier. This lesson describes the metrics typically available in Enterprise plans.
Key metrics explained
Active users
Definition: the number of unique users who sent at least one message to Claude in the selected time period (typically last 7 days, 30 days, or custom range).
Why it matters: this is your adoption rate numerator. Divide by total seats to get your adoption percentage. An adoption rate below 50% after three months indicates a problem; above 70% is healthy for a mature deployment.
What to do with it:
- Track week-over-week to see growth trends
- Identify departments with low active users — is there an onboarding gap?
- After training events, check whether active users increased
Messages sent
Definition: total messages sent across the organisation in the selected period.
Why it matters: this tracks engagement depth. High active users but low messages per user suggests people tried Claude once or twice but did not find a repeating use case. You want active users sending 20–50 messages per week, not 2.
Derived metric: messages per active user per week = messages sent ÷ active users ÷ weeks in period. This is your engagement intensity metric. In a healthy deployment, this typically grows from 5–10 in the first month to 20–40 at six months for regular users.
Usage by Project
Where your analytics include Project-level breakdowns:
- Which Projects are most active? (Your highest-value use cases)
- Which Projects are dormant? (Candidates for archival)
- Which users are using which Projects? (Adoption patterns by function)
This data is particularly valuable when reporting to leadership: "Our Contract Review Project processed 340 contracts last month, replacing approximately 85 hours of first-pass review time."
Model usage
If your contract includes multiple model tiers (fast, standard, frontier), the dashboard shows usage by model. This matters for cost management: if the majority of messages are using the frontier (most expensive) model on tasks that do not require it, reconfiguring Projects to use the standard model reduces cost without reducing quality for most use cases.
Interpreting the data: common patterns
The "spike and drop" pattern
What it looks like: large number of active users in the first week, then a sharp drop to 20–30% of initial users by week four. What it means: good initial curiosity but poor retention. The onboarding experience did not connect people to a repeating use case. Intervention: identify the retention cohort (who stayed?), interview them to understand their use cases, and use those as examples in re-engagement outreach to dormant users.
The "power user cluster" pattern
What it looks like: 10–15% of users account for 60–70% of messages. The remaining users send very few messages. What it means: Claude has found its champions, but has not scaled to the broader population. Intervention: make the power users internal advocates. Ask them to share their use cases in the #claude-help Slack channel or at a team all-hands. Case studies spread adoption better than training sessions.
The "Project desert" pattern
What it looks like: high overall message volume but concentrated in general conversations (not in Projects). What it means: users are getting value from Claude but are not using the structured, governed workflows you have built. Intervention: check whether existing Projects are easy to find and whether their use cases match what users are actually doing. Revise Project descriptions and promote them in onboarding materials.
Exporting data
For organisations that need to report usage data to finance (for chargeback), to leadership (for ROI presentations), or to compliance (for audit evidence), the Admin Console typically allows CSV export of usage data.
To export:
- Navigate to the analytics section.
- Set the date range.
- Click Export or Download CSV.
- The export includes: user-level message counts, active days, model usage, and Project associations (where available).
Keep exports in a shared location accessible to the relevant stakeholders (IT admin, Finance, HR/L&D as appropriate). Do not share individual-level data with managers without reviewing your employee monitoring policy — in many jurisdictions, granular monitoring of individual AI tool usage requires disclosure to employees.
Scenario: the 90-day review presentation
Three months after deploying Claude to 150 users, the IT Director presents to the Executive Committee. She pulls the following from the Usage Dashboard:
- Active users at 30 days: 89 (59%)
- Active users at 90 days: 118 (79%) — adoption growing
- Average messages per active user per week at 90 days: 28 — healthy engagement
- Top Projects by message volume: Contract Review (3,200 messages), HR Job Descriptions (1,800), Finance Commentary (1,400)
- Contract Review Project has saved an estimated 140 hours of first-pass review time (based on 350 contracts × 24 minutes average review time)
The Executive Committee approves expanding from 150 to 250 seats.
Key takeaway
The Usage Dashboard is your accountability tool. Check active users weekly, review Project-level data monthly, and build a quarterly summary for leadership. The data is only valuable if you use it to make decisions — about onboarding, Project design, contract renewal and seat allocation.
📖 Official Documentation See this in practice in Anthropic’s live support docs: